The forgetting curve: what Ebbinghaus's data really shows
In 1885, Hermann Ebbinghaus published the first measurement of forgetting. His curve shows up in almost every training program, often with numbers he never obtained, like the famous “70% forgotten in 24 hours”. His actual results, confirmed by a replication in 2015, are still useful if you want training to stick.

What Ebbinghaus measured in 1885.
Hermann Ebbinghaus, a German psychologist, published Über das Gedächtnis (“On Memory”) in 1885, the first experimental study of forgetting. He was both the experimenter and the only subject.
To keep meaning from helping his memory, he made up syllables with no meaning, built from a consonant, a vowel and a consonant. He grouped them into series of 13 and learned each series until he could recite it without a mistake.
After a delay of 20 minutes to 31 days, he relearned the same series and noted how long it took him to know them again. The difference from the first learning is what he called “savings”: if the second time took only half as long, the savings were 50%.
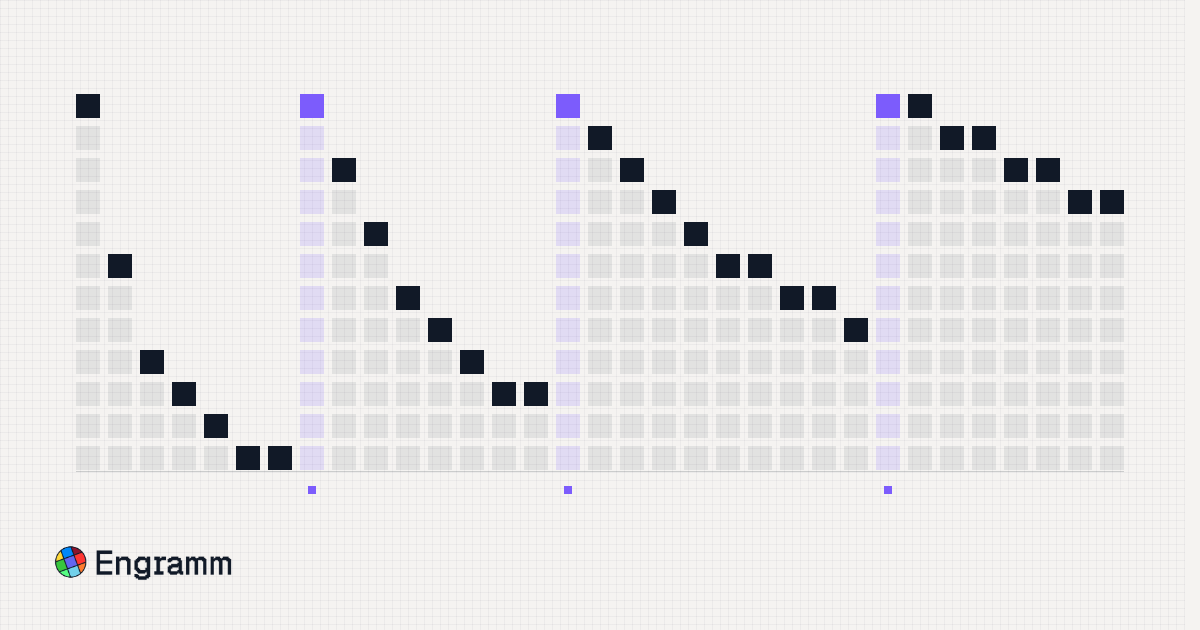
The forgetting curve plots these savings. It measures what remains of something learned, even when you can no longer recite it. It is not a percentage of information remembered.
In short
Ebbinghaus measured, on himself, the time saved when relearning series of nonsense syllables. The forgetting curve plots these savings.
The curve's real numbers.
Chapter 7 of his book gives the results for each delay between learning and relearning:
| Delay | Savings when relearning |
|---|---|
| 20 minutes | 58.2% |
| 1 hour | 44.2% |
| 9 hours | 35.8% |
| 1 day | 33.7% |
| 2 days | 27.8% |
| 6 days | 25.4% |
| 31 days | 21.1% |
The shape is the familiar one: the loss is steep in the first hour, then slows down sharply. Between day 1 and day 31, savings drop by only 12.6 points.
These numbers come from one person, Ebbinghaus himself, learning nonsense syllables under very controlled conditions. They describe a real phenomenon, but they don't carry over as is to a training module.
In short
Savings fall from 58.2% after 20 minutes to 33.7% after a day, then to 21.1% after a month: the loss is steep at first, then slows.
Where “70% forgotten in 24 hours” comes from.
The figure circulates in articles, training decks and AI assistants' answers, sometimes in another version: “90% forgotten within a week.” Neither appears in Ebbinghaus's results.
His table has another column: the share of the original learning time he had to spend again to relearn a series. At 24 hours it is 66.3%, which is 100% minus the 33.7% savings. Rounded to 70% and read as a share of content forgotten, this number is probably where the myth comes from. Yet it is about relearning time, and about nonsense syllables.
Another frequent source is a fact sheet from the University of Waterloo, in Canada, which described what a student forgets from a one-hour lecture without citing any study. It has since been taken down from the university's website, but it is still cited, including by the French-language Wikipedia article on the forgetting curve.
For corporate training, the practical conclusion is still Ebbinghaus's: without review, what was learned fades fast at first, then more slowly. The exact percentages belong to his experiment.
In short
“70% forgotten in 24 hours” probably comes from a column expressed in relearning time, read as a share of content forgotten.
What the 2015 replication confirms.
In 2015, Jaap Murre and Joeri Dros, from the University of Amsterdam, published a replication of the experiment in PLOS ONE. The subject was Joeri Dros himself, who followed Ebbinghaus's protocol for 70 hours of learning and relearning.
| Delay | Ebbinghaus (1885) | Murre and Dros (2015) |
|---|---|---|
| 20 minutes | 58.2% | 47.2% |
| 1 hour | 44.2% | 37.3% |
| 9 hours | 35.8% | 27.6% |
| 1 day | 33.7% | 31.7% |
| 2 days | 27.8% | 23.0% |
| 6 days | 25.4% | 16.8% |
| 31 days | 21.1% | 4.1% |
Savings when relearning. Source: Murre and Dros (2015), table 3, which includes Ebbinghaus's values for comparison.
The authors conclude that Ebbinghaus's curve was successfully replicated. The replication's values are somewhat lower, especially at 31 days.
They also point out a detail the smoothed curve hides: at 24 hours, savings are higher than a regular curve would predict. In their replication, they even rise between 9 and 24 hours, from 27.6% to 31.7%. Since Jenkins and Dallenbach's work in 1924, several researchers have attributed this bump to sleep, during which memory consolidates what was learned during the day.
In short
A replication published in 2015 found the same curve, with a bump at 24 hours that several researchers attribute to sleep.
What the curve doesn't say about corporate training.
Nonsense syllables were chosen to isolate memory from everything else. Ebbinghaus first tried learning stanzas of a Byron poem, Don Juan, then gave up on them for his measurements: the meaning of the verses varied too much from one stanza to the next. That is what gives the experiment its scientific value, and also its limit for training.
Training content has meaning. A procedure tied to daily work, a product you sell every week or a compliance rule you apply connect to what people already know, which helps them remember.
The curve is also about knowledge you recite. A large part of corporate training targets skills: running a discovery meeting, handling an objection, breaking bad news to a customer. Skills fade too, and you check them by putting them into practice.
What you can take from the curve, then, is its shape: forgetting is fast right after learning, then slows down. A first review in the days after a training session comes when the loss is steepest.
In short
Training content has meaning and often targets skills. What to keep from the curve is its shape: the loss is steepest right after training.
Spacing out reviews after training.
Ebbinghaus had already observed that repetitions spread over several days worked better than the same number of repetitions done at once. This “spacing effect” has since been found in hundreds of experiments, pulled together in 2006 by Nicholas Cepeda and colleagues in a meta-analysis.
After a training session, this means short reviews at increasing intervals. A sample schedule, to adapt:
- the next day, a five-question quiz on the key concepts;
- a week later, a set of question-and-answer flashcards;
- a month later, a roleplay on a real case.
These delays are guidelines, to adjust to the topic and the team's pace. Flashcard apps go further: the Leitner system, then spaced repetition algorithms, adjust each card's interval based on the answer given. A concept you know well comes back later, and one you missed comes back soon.
Template to download: review schedule after training
Reviews at day 1, day 7 and day 30 with their dates and scores, and a table to track what remains topic by topic, as a one-page PDF.
In short
Short reviews at increasing intervals (for example day 1, day 7 and day 30) work better than the same review done in one go.
Practice instead of rereading.
Rereading a document gives an impression of mastery, because the text feels familiar. Testing yourself takes a memory effort, and that effort makes things stick. In 2006, Henry Roediger and Jeffrey Karpicke compared the two: students who had read a text and then tested themselves on it remembered more of it a week later than those who reread it, even though the rereaders did better on a test taken right away.
This is called the testing effect. In training, it means quizzes, flashcards, or explaining a topic to someone. In an interactive course, for example, the AI coach asks questions as it presents and explains again when an answer is wrong.
For a conversation skill, testing yourself means having the conversation again. A roleplay forces you to find the argument, the question or the wording at the right moment, facing someone who doesn't follow the script, for instance the question that reveals a customer's buying motive. With AI roleplays, you replay it against an AI character until the right answer comes on its own.
In short
Testing yourself works better than rereading. For a conversation skill, testing yourself means having the conversation again.
Measure what remains a few weeks later.
Most training is evaluated the same day, with a satisfaction survey or a final test. That test measures what learners know at the moment they remember it best.
To know what sticks, you have to measure later:
- the same quiz at day 7 and day 30, compared with the end-of-training score;
- the same roleplay repeated three or four weeks later, with the same scorecard;
- the concepts most often missed, to revisit in a refresher session or with the trainer.
In Engramm, quizzes give a score per topic, and each simulation ends with a scorecard on your criteria. Both are measurements you can repeat over time and compare.
In short
The end-of-training test measures the high point of the curve. A quiz or roleplay repeated a few weeks later measures what remains.
Frequently asked questions.
What is the forgetting curve?
It is the curve Hermann Ebbinghaus published in 1885 to describe how learning fades over time. He obtained it by relearning series of nonsense syllables after delays of 20 minutes to 31 days. The loss is fast in the first hour, then slows down sharply.
How do you beat the forgetting curve?
By spacing out reviews after learning, at increasing intervals, and by testing yourself rather than rereading: quizzes, flashcards, roleplays. Content tied to daily work is also easier to remember than abstract content.
What are the stages of memory?
Three are usually distinguished: encoding, when information is learned; storage, during which it consolidates, especially during sleep; and retrieval, when you find it again to use it. The forgetting curve describes what remains available over time.
Do the curve's numbers apply to training?
Not directly. Ebbinghaus measured the time saved when relearning nonsense syllables, on himself. Training content has meaning and connects to what the learner already knows. You can keep the shape of the curve; the percentages belong to his experiment.
Sources.
- Hermann Ebbinghaus, Memory: A Contribution to Experimental Psychology (1913 English translation), chapter 7: psychclassics.yorku.ca
- Jaap Murre and Joeri Dros (2015), “Replication and Analysis of Ebbinghaus' Forgetting Curve”, PLOS ONE: pmc.ncbi.nlm.nih.gov
- Henry Roediger and Jeffrey Karpicke (2006), “Test-Enhanced Learning”, Psychological Science, 17(3).
- Nicholas Cepeda et al. (2006), “Distributed Practice in Verbal Recall Tasks”, Psychological Bulletin, 132(3).
- University of Waterloo, “Curve of Forgetting” fact sheet (2020 archive): web.archive.org